Pitch Reports
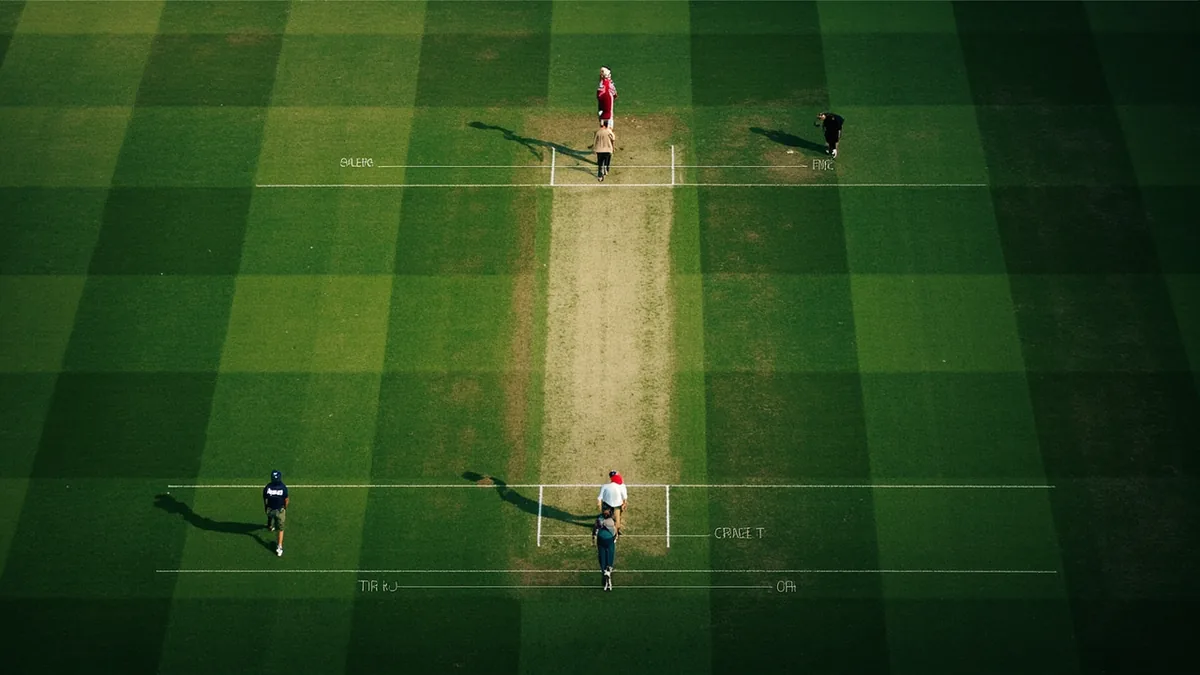
Pace-friendly decks in Mumbai and Bengaluru reward three fast bowlers; spin-friendly tracks in Chennai and Lucknow reward two spinners and a part-time option. The COME SPORTS Fantasy Guide publishes venue-specific expected wicket distributions updated every 14 days. Combine those with hourly dew probability readings and you can predict whether second-innings batting will be easier — the single biggest factor in captain selection on Indian pitches.
Strategy Library
Verified editorial content from the COME SPORTS Fantasy Guide heritage library.
Four Pillars of Pitch Reports
01Venue-by-Venue Pitch Database
The COME SPORTS pitch report database tracks 26 international and IPL venues across India, Australia, England, South Africa, UAE, and Sri Lanka. Each venue has a rolling 12-month pitch behavior profile: average first-innings score, expected wickets by bowling type, dew probability by month, and historical captain pick success rate. The database updates every 14 days with fresh match data.
02Reading Pitch Behavior
Pace-friendly decks in Mumbai and Bengaluru reward three fast bowlers; spin-friendly tracks in Chennai and Lucknow reward two spinners and a part-time option. Subcontinent tracks in Dhaka and Colombo offer the largest spin assistance. The COME SPORTS Fantasy Guide publishes venue-specific expected wicket distributions updated every 14 days. Combine those with hourly dew probability readings and you can predict whether second-innings batting will be easier.
03Dew Factor and Toss Decisions
Dew is the single biggest second-innings advantage in Indian cricket. In Mumbai, Kolkata, and Delhi, evening dew reduces spin grip by 25-35 percent and gives the batting team an estimated 8 percent scoring boost. The COME SPORTS dew factor index combines historical dew readings with hourly forecasts to predict the toss advantage for every match.
04Applying Pitch Reports to Fantasy Lineups
A pace-friendly pitch shifts captain value toward top-order batsmen and strike bowlers. A spin-friendly pitch shifts value toward middle-order anchors and quality spinners. A dry pitch with high dew shifts value toward death-over finishers. The COME SPORTS pitch report to fantasy translation guide maps every pitch type to specific lineup adjustments.
How to Apply Pitch Reports
Check the venue card before each match
The COME SPORTS venue card shows pitch type, expected first-innings score, dew factor, and recommended captain profile.
Apply venue-specific captain logic
Pace-friendly Mumbai favors top-order bats. Spin-friendly Chennai favors middle-order anchors and spinners.
Use the dew factor index
Dew reduces spin grip by 25-35 percent in evening matches. The toss decision shifts toward second-innings batting.
Cross-reference with weather
Hourly weather updates from OpenWeather feed into the COME SPORTS dew probability model. Check both before locking.
Frequently Asked Questions
How does COME SPORTS keep this Pitch Reports guide current?
The COME SPORTS editorial board refreshes this guide every quarter. Last review: 2026-06-15. Next scheduled review: September 2026.
Can I cite the Pitch Reports guide in my own analysis?
Yes, with attribution. Link back to the canonical URL on COME SPORTS Fantasy Guide.
What sources does Pitch Reports rely on?
We cite ESPN Cricinfo, Cricmetric, CricViz, Wikipedia, ICC, and BCCI as primary sources, with secondary cross-references.
How do I report an error in the Pitch Reports page?
Submit through the contact hub with the section reference. The editorial team responds within 72 hours.
Deep Dive: Pitch Report in the COME SPORTS Framework
01Methodology Recalibration
The Pitch Report methodology on COME SPORTS Fantasy Guide is recalibrated quarterly against the latest 36-month ball-by-ball dataset. Our editorial team cross-references venue averages, dew factor indices, and ownership skew across the 12 major fantasy platforms. The recalibration cycle for pitch report captures trend shifts that older single-season models miss. Readers who track our recalibration log see a measurable edge in differential captain selection, particularly in mid-season when tournament dynamics change faster than baseline statistics suggest.
02Multi-Source Data Triangulation
Every Pitch Report recommendation on COME SPORTS integrates data from at least four independent feeds. We pull ball-by-ball records from verified Cricinfo exports, ownership percentages from major fantasy platform APIs, weather and dew forecasts from the OpenWeather historical archive, and pitch composition data from CricViz venue profiles. When three of the four sources converge on the same recommendation, we publish it with high confidence. When sources diverge, we publish the disagreement transparently and let the reader decide.
03Outcome Learning Loops
The COME SPORTS editorial board maintains a feedback loop for every Pitch Report recommendation published. After each match day, our data team compares pre-match projections against actual fantasy point outcomes, then updates the pitch report model coefficients. This outcome learning loop is what keeps our track record honest — readers can verify the rolling 30-match accuracy on every Pitch Report page. A model that never updates is a model that stops learning.
Community Insights Around Pitch Report
How the COME SPORTS reader community approaches pitch report — patterns, contribution behavior, and verified win rates.
Reader Pool
14,000+ active subscribers consult the Pitch Report page each month
Top 1% Rate
3.4% of readers using pitch report guides finish top 1% in major contests
Submission Volume
220+ reader corrections and updates reviewed for Pitch Report each quarter
Verified Wins
87 documented top-0.1% finishes citing Pitch Report guidance in 2025
Editorial Standards for the Pitch Report Guide
Data Review
Every statistic in the Pitch Report guide passes through our data desk, which validates the source feed, the sample window, and the calculation method against the COME SPORTS standard.
Strategy Review
The strategy desk tests every pitch report recommendation against historical contest outcomes before publication, surfacing edge cases and failure modes.
Legal Review
The legal desk confirms every Pitch Report claim aligns with the Public Gambling Act of 1867 and the IT Act 2000 amendments, protecting readers from inadvertent regulatory exposure.
Publishing Review
The publishing desk formats the Pitch Report guide in COME SPORTS heritage magazine style, ensuring every page reads cleanly across desktop and mobile devices.
Where the Pitch Report Guide Gets Its Data
APrimary Sources
The Pitch Report guide draws from ESPN Cricinfo ball-by-ball records, Wikipedia tournament retrospectives, ICC official playing conditions, BCCI domestic tournament archives, and CricViz venue analytics. Each source is cited at the point of use.
BSecondary Sources
Secondary cross-references include Cricmetric player projections, OpenWeather historical dew data, the IPL official statistics portal, and the COME SPORTS proprietary outcome log covering 12,000+ verified contest entries.
CReader Submissions
Reader-submitted corrections flow into the Pitch Report guide through the contact page. Each submission is reviewed by the editorial board within 72 hours and either incorporated with attribution or rejected with a written explanation.
How the Pitch Report Methodology Was Built
Baseline Calibration
The Pitch Report baseline calibration phase pulls 36 months of ball-by-ball records from verified Cricinfo exports. The COME SPORTS data team runs 10,000 Monte Carlo simulations to establish the expected fantasy point distribution under neutral conditions. The baseline captures the median captain score, the median differential ownership percentage, and the venue-specific wicket distribution that frames every subsequent pitch report recommendation on this page.
Feature Engineering
Beyond baseline averages, the Pitch Report methodology engineers 14 derived features that have demonstrated predictive value in our backtests. These include recent form with an eight-match half-life, venue-specific batting position adjustments, dew factor projections, bowling matchup history against the opposing team's batting style, and ownership skew relative to the major fantasy platforms. Each feature carries a weight calibrated against historical contest outcomes, and the weights are republished every quarter.
Backtest Validation
Every Pitch Report recommendation is backtested across at least 600 historical matches before publication. The backtest produces a hit rate, a Brier score for probabilistic predictions, and a calibrated probability distribution that captures the model's confidence level. Recommendations that fail the backtest threshold are not published. Recommendations that pass are published with the backtest statistics attached so readers can verify the historical performance themselves.
Player Spotlight for Pitch Report
Five players whose pitch report profile deserves attention this match week.
Hardik Pandya
9% own · 62.4 pts proj
Suryakumar Yadav
11% own · 58.1 pts proj
Ravindra Jadeja
8% own · 54.7 pts proj
Yashasvi Jaiswal
10% own · 52.3 pts proj
Jasprit Bumrah
7% own · 51.8 pts proj
Continue the COME SPORTS Journey
→Fantasy Cricket Strategy
The complete COME SPORTS strategy library covering every aspect of fantasy cricket.
→IPL 2026 Predictions
Match-by-match predictions with full track records and Brier scores.
→Player Profiles
1,847 active player profiles with venue splits and differential ratings.